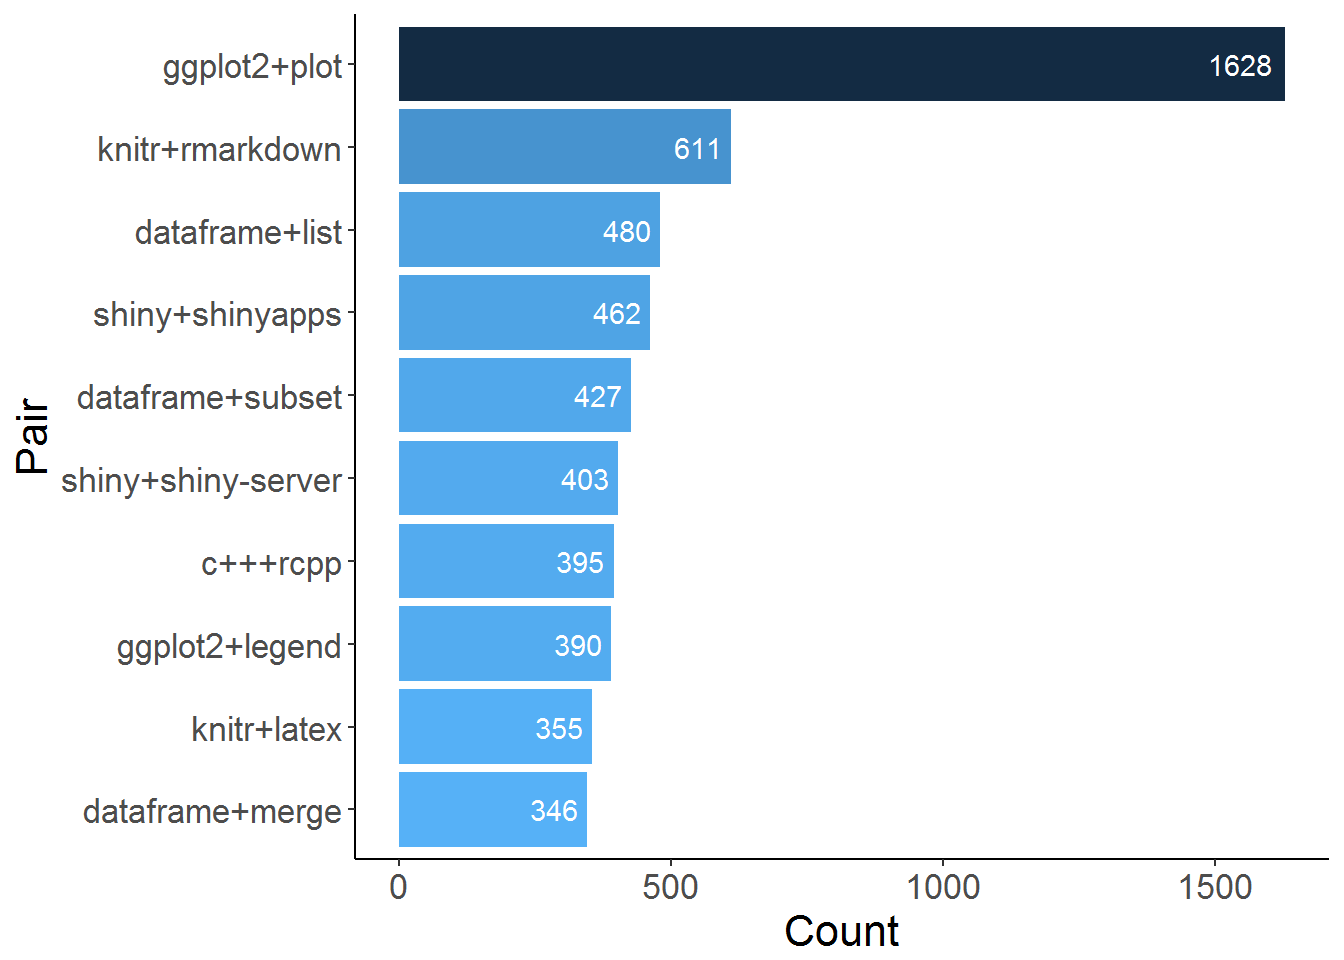
Months ago, I passed by R Questions from Stack Overflow published on Kaggle. I was interested in tag pairs in particular, i.e. which tags appear together in R questions, so I worked on this simple kernel.
This week, I had some time so I thought about deploying a simple Shiny App, to give more people access to exploring the tag pairs. So here is the App, where you can see the most frequent tags that appear with a certain tag. And below is the full code of how I processed and aggregated the data.
R Tag Pairs Shiny App
Data Aggregation
I selected the questions with more than one tag (in addition to R) and did the following:
- Step 1: get all the tags corresponding to question ID
- Step 2: find all pair combinations from these tags
- Step 3: combine all pairs from all the questions in one dataframe
Step 1: get all the tags corresponding to question ID
# group by question ID and nest tags
datn <- dat %>%
  group_by(Id) %>%
  filter(n()>1) %>%
  nest(.key="Tags")
Now if we look at a certain question ID, we find all the tags in one list, for example for Q#79709
[[1]]
# A tibble: 4 × 1
               Tag
             <chr>
1           memory
2         function
3 global-variables
4     side-effects
Step 2: find all pair combinations from these tags
Now, we will get all the possible pairs from the questions' tags:
# map each Tag list to combn() to get all the combinations from a list
datn <- datn %>%
  mutate(pairs=map(Tags, ~combn(.x[["Tag"]], 2) %>%
                     t %>%
                     as.data.frame(stringsAsFactors = F)))
For the same question we checked in the previous step, we can see that the pairs are as follows:
[[1]]
                V1               V2
1           memory         function
2           memory global-variables
3           memory     side-effects
4         function global-variables
5         function     side-effects
6 global-variables     side-effects
Step 3: combine all pairs from all the questions in one dataframe
Now we will combine all the pairs from all questions in one dataframe and count the freq of each pair:
# combine all pairs in one dataframe
dat_pairs <- plyr::rbind.fill(datn$pairs)

# put pairs in the same order
dat_pairs <- dat_pairs %>%
  mutate(firstV=map2_chr(V1,V2,function(x,y) sort(c(x,y))[1]),
         secondV=map2_chr(V1,V2,function(x,y) sort(c(x,y))[2])) %>%
  select(-V1,-V2)

# count the frequency of each pair
pair_freq <- dat_pairs %>%
  group_by(firstV,secondV) %>%
  summarise(pair_count=n()) %>%
  arrange(desc(pair_count)) %>%
  ungroup()
Here we can see the top 10 pairs:

Tag-Pairs for a Certain Tag
Here we can pick one tag and see all the other tags that appear with it and the frequency of each.
# Get all pairs with a certain tag
GetTagPairs <- function(df, tag) {
  df %>%
    filter(firstV==tag|secondV==tag) %>%
    arrange(desc(pair_count)) %>%
    mutate(T2 = ifelse(secondV==tag, firstV, secondV)) %>%
    select(T2, pair_count)
}
Example: ggplot2 Pairs
If we take ggplot2 for example, we can see the most frequent tags that appeared with it as follows:
ex <- GetTagPairs(pair_freq, "ggplot2")

head(ex,10)
# A tibble: 10 × 2
          T2 pair_count
       <chr>      <int>
1       plot       1628
2     legend        390
3  bar-chart        313
4    boxplot        288
5      shiny        275
6  histogram        262
7      facet        252
8     colors        211
9      ggmap        211
10     graph        204
You can see the whole list for any tag in Shiny App.
In conclusion
Pair tags give us an idea about the areas of interest, the relations between topics/packages, and the frequently used packages in the R community. We can also draw a full network to visualize more complex relations. However, these were the tags in questions posted till 19 October 2016. Definitely things change, and more tags get into the list with time. I personally expect that Tidyverse and its packages are mentioned more frequently in 2017. An updated dataset would help confirm this hypothesis!