A couple of months ago, Tidy eval was something that I passed by, but didn’t have time to explore. As usual, sometimes one gets busy with the daily work, and puts some stuff aside to come back to. However, I like to find ways that give me a higher level of flexibility and more control. So mid June, I had an inquiry regarding programming around dplyr. I wasn’t sure how to pass a variable column names to purrr::map, so I opened an issue; purrr::map() support for SE/variable column names?.
Jenny Bryan and Lionel Henry guided me to different ways to approach the problem, mentioning Tidyeval. So it was time I got to know it for real. I have to say that I am still exploring its capabilities and use cases, but this post is about my first steps!
What I Wanted to Do
What led me to Tidy eval was the the desire to prgram around dplyr. The example I shared in the issue was having a list column Tags_terms in a dataframe dat_r, that I wanted to mutate with the count of tags in each row. Pretty simple!
library(dplyr)
library(purrr)

dat_r <- tribble(
  ~ Tags_terms,
  c("R", "ggplot2","dplyr"),
  "tidyverse",
  c("dplyr", "lubridate")
)
The straightforward way was:
dat_r %>%
  mutate(tags_count = map_int(Tags_terms, length))
# A tibble: 3 x 2
Tags_terms tags_count
<list> <int>
1 <chr [3]> 3
2 <chr [1]> 1
3 <chr [2]> 2Which Limitations I Faced
However, I wanted to be able to pass the column as a variable, because it could be Tags_terms or any other name. Moreover, I wanted to have the option of wrapping this into a function. So I wondered whether there was a way to achieve this. Definitely I knew that doing something like the following was not the right thing. The column name would not be seen. Instead, cname would be seen as a character vector with 1 element!
cname <- "Tags_terms"
dat_r %>%
  mutate(tags_count = map_int(cname, length))
# A tibble: 3 x 2
Tags_terms tags_count
<list> <int>
1 <chr [3]> 1
2 <chr [1]> 1
3 <chr [2]> 1How Tidy eval Helped Me
At this point, I opened the issue and one of the suggestion was to use quo which “quotes its input rather than evaluating it” then !! to unquote the input to be evaluated. This seems confusing at the beginning, but let’s see how it works!
As we can see, cname quotes the input Tags_terms and returns a quosure (a special type of formula). Then it gets unquoted using !!, and that’s how we get the desired result.
cname <- quo(Tags_terms)
print(cname)
<quosure>
expr: ^Tags_terms
env: globaldat_r %>%
mutate(tags_count = map_int(!!cname, length))# A tibble: 3 x 2
Tags_terms tags_count
<list> <int>
1 <chr [3]> 3
2 <chr [1]> 1
3 <chr [2]> 2Turning the code into a function
Having this kind of flexibility, we can create general functions like add_tag_count to reuse for the same purpose. But inside a function, we use enquo which “sees what the user typed, and returns that value as a quosure”.
add_tag_count <- function(x, cname){

  cname <- enquo(cname)

  x %>%
    mutate(tags_count = map_int(!!cname, length))
}
So here we can see how it works properly with dat_books.
dat_books <- tribble(
  ~ genre,
  c("fiction", "comedy"),
  c("tragedy", "fiction", "fantasy"),
  c("satire", "tragedy")
)

add_tag_count(dat_books, genre)
# A tibble: 3 x 2
genre tags_count
<list> <int>
1 <chr [2]> 2
2 <chr [3]> 3
3 <chr [2]> 2Varying the name of the output variable
In the previous function, the new column will always be called tags_count. What if we wanted to call it genre_count in the dat_books example, or any other arbitrary name?
We need to do the following:
Use
quo_name()to convert the input expression to stringUse
:=helper provided byrlang
add_tag_count <- function(x, cname, count_col){

  cname <- enquo(cname)

  count_col <- enquo(count_col)
  count_col_name <- quo_name(count_col)

  x %>%
    mutate(!!count_col_name := map_int(!!cname, length))
}
And now we can pass both the list column name genre, and the desired output name genre_count.
add_tag_count(dat_books, genre, genre_count)# A tibble: 3 x 2
genre genre_count
<list> <int>
1 <chr [2]> 2
2 <chr [3]> 3
3 <chr [2]> 2Other Examples using Tidy eval
After getting acquainted with Tidy eval, I had other situations when I wanted to to write general functions to avoid repetition. So here are two examples:
Example 1 : Capturing multiple variables
Here I wanted to write a function that:
takes multiple columns
group_by the given columns
provides the count of each group and the percentage (if TRUE), descendingly ordered
So to capture multiple variables, we can:
use
quos()xto capture all the … as a list of formulas.use
!!!to splice the arguments intogroup_by()
freq_tbl <- function(df, ..., percent = TRUE){
  group <- quos(...)

  out <- df %>%
    group_by(!!!group) %>%
    summarise(freq = n()) %>%
    arrange(desc(freq)) %>%
    ungroup()

  if(percent == TRUE){
    out <- out %>%
      mutate(percentage = 100*freq/sum(freq))
  }
  return(out)
}
Now we can use it with any number of variables. For instance, if we use starwars dataset, we pass any number of columns.
Here we pass homeworld & species to group by.
starwars_gp2 <- starwars %>%
  freq_tbl(homeworld, species, percent = F)

head(starwars_gp2)
# A tibble: 6 x 3
homeworld species freq
<chr> <chr> <int>
1 Tatooine Human 8
2 Naboo Human 5
3 <NA> Human 5
4 Alderaan Human 3
5 Naboo Gungan 3
6 Corellia Human 2Similarly, we can simply add gender or any other column.
starwars_gp3 <- starwars %>%
  freq_tbl(homeworld, species, gender)
head(starwars_gp3)
# A tibble: 6 x 5
homeworld species gender freq percentage
<chr> <chr> <chr> <int> <dbl>
1 Tatooine Human male 6 6.90
2 <NA> Human male 4 4.60
3 Naboo Gungan male 3 3.45
4 Naboo Human female 3 3.45
5 Alderaan Human male 2 2.30
6 Corellia Human male 2 2.30Example 2: Ngrams Table
In this case, I wanted to create unigrams. bigrams and trigrams tables with counts In the normal case, this means writing identical lines three times (as shown below), with minor changes in the type of ngrams, and the name of the output columns.
library(tidytext)
library(janeaustenr)


# unigram table
unigrams <- data_frame(txt = prideprejudice) %>%
  unnest_tokens(ngram, txt, token = "ngrams", n = 1) %>%
  rename(unigram = ngram) %>%
  group_by(unigram) %>%
  summarise(unigram_freq = n()) %>%
  arrange(desc(unigram_freq))

# bigram table
bigrams <- data_frame(txt = prideprejudice) %>%
  unnest_tokens(ngram, txt, token = "ngrams", n = 2) %>%
  rename(bigram = ngram) %>%
  group_by(bigram) %>%
  summarise(bigram_freq = n()) %>%
  arrange(desc(bigram_freq))

# bigram table
trigram <- data_frame(txt = prideprejudice) %>%
  unnest_tokens(ngram, txt, token = "ngrams", n = 3) %>%
  rename(trigram = ngram) %>%
  group_by(trigram) %>%
  summarise(trigram_freq = n()) %>%
  arrange(desc(trigram_freq))
So how can we wrap this into a general function?
Ideally, we would like to write a function that takes:
n: the type of ngramgram_col: the name of the ngram columnfreq_col: the name of the ngram count column
And this can be achieved as follows:
create_gram_table <- function(input_txt, n, gram_col, freq_col){

  gram_col <- enquo(gram_col)
  gram_col_name <- quo_name(gram_col)

  freq_col <- enquo(freq_col)
  freq_col_name <- quo_name(freq_col)

  x <- data_frame(txt = input_txt)

  g <- tidytext::unnest_tokens(x, ngram, txt,
                               token = "ngrams", n = n) %>%
    rename(!!gram_col_name := ngram) %>%
    group_by(!!gram_col) %>%
    summarise(!!freq_col_name := n()) %>%
    arrange(desc( !!freq_col))

  return(g)
}
So now instead of the duplication, we can use create_gram_table, which gives us the desired output with less repetition.
create_gram_table(prideprejudice, 1, unigram, unigram_freq) %>% head# A tibble: 6 x 2
unigram unigram_freq
<chr> <int>
1 the 4331
2 to 4162
3 of 3610
4 and 3585
5 her 2203
6 i 2065create_gram_table(prideprejudice, 2, bigram, bigram_freq) %>% head# A tibble: 6 x 2
bigram bigram_freq
<chr> <int>
1 of the 464
2 to be 443
3 in the 382
4 i am 302
5 of her 260
6 to the 252create_gram_table(prideprejudice, 3, trigram, trigram_freq) %>% head# A tibble: 6 x 2
trigram trigram_freq
<chr> <int>
1 i am sure 62
2 i do not 59
3 as soon as 55
4 she could not 50
5 that he had 37
6 in the world 34Tidy eval & ggplot2
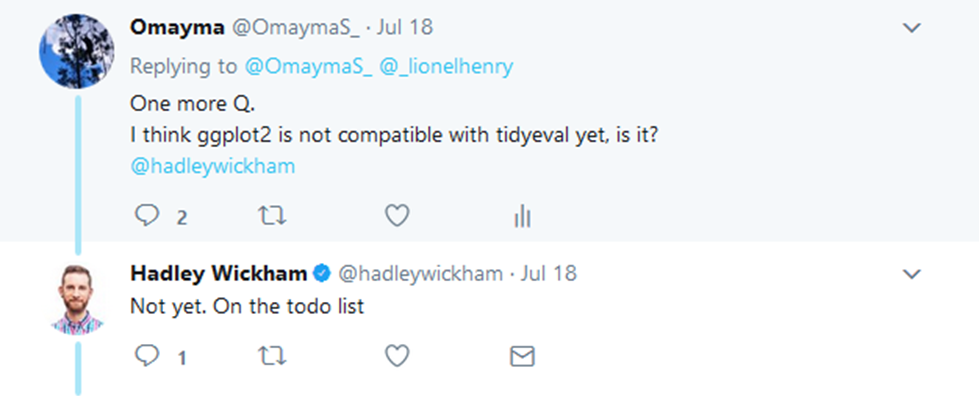
After using tidy eval in some examples, I thought it would be great to have it with ggplot2. So I tried it but it didn’t work. I didn’t know whether I was missing something or they were not compatible yet. I asked to find out, and the answer was that ggplot2 was planned to be ported to tidy eval within months. So I am looking forward!

Conclusion
So those were my first steps in the world of the Tidy eval. I like how it gives me more control and flexibility, yet I am still learning and grasping its capabilities. I am not sure if all what I am doing adheres to the best practices, so I’ll keep learning about it. And I’d be grateful to receive any feedback regarding the use cases I showed and better ways to handle them